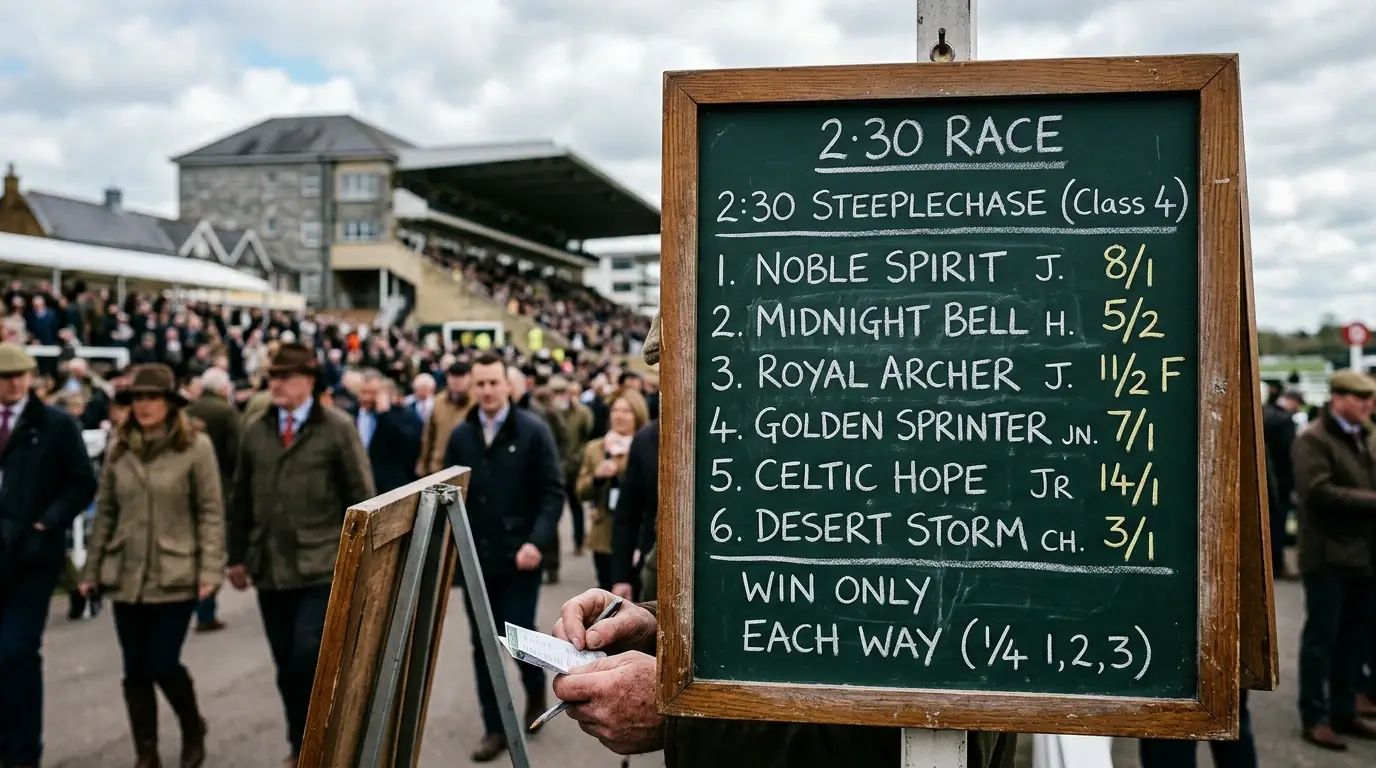
Horse Racing Trainer and Jockey Statistics: Strike Rates, Course Specialists and Winning Combinations
 Available in US
An old colleague once gave me a piece of advice that paid for itself many times over: never bet a horse without knowing what its trainer’s last fourteen days have looked like. He didn’t mean glance at the form figures. He meant actually know — how many runners, how many winners, how many placed, what classes. The information sits in plain sight on every racecard, and most punters don’t even glance at it. That gap is the entire opportunity.
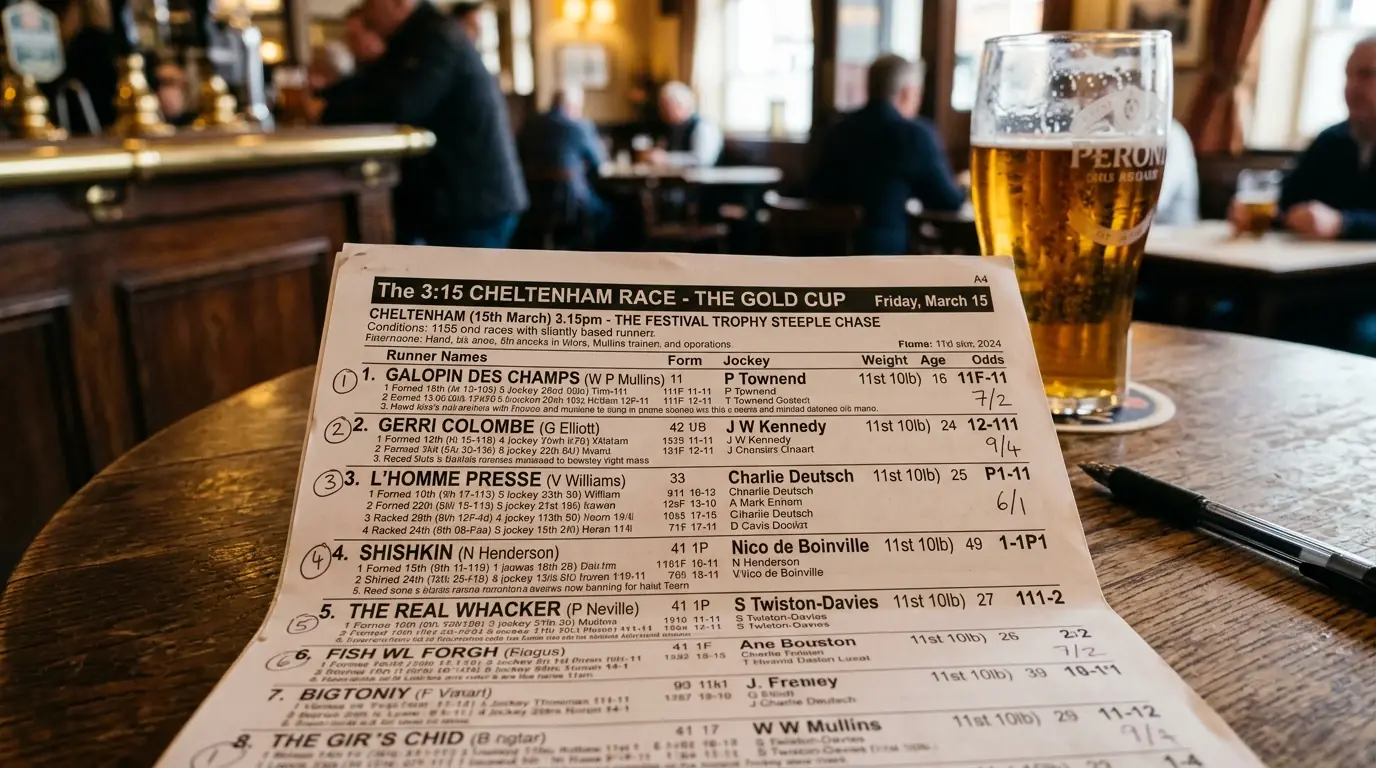
Trainer and jockey statistics are not the most glamorous corner of racing analysis, but they’re consistently among the most underused. The market prices horses based on form figures and recent results. Punters who layer trainer form, jockey strike rates, and course-specific specialisation on top of that base operate with an information advantage that compounds across a season. None of this requires expensive data subscriptions. Most of it is freely available on the Racing Post racecard.
This article covers the trainer metrics that actually predict performance, the jockey statistics worth tracking, why trainer-jockey combinations matter, and how to apply this data without falling into the trap of mechanical betting.
Key Trainer Metrics: Strike Rate, ROI and Course Form
Walk into any conversation among serious punters at a UK racecourse and you’ll hear the same names dropped repeatedly. Not because those trainers are best in some abstract sense, but because their current strike rates are running at levels that make their horses worth a second look on the racecard. The metric that matters is contextual — it’s not about who’s good in general but about who is running hot right now.
The first number to track is the 14-day strike rate. This is the percentage of a trainer’s runners over the last fourteen days that have won. A 25% or higher strike rate over a 14-day window with at least eight runners is a meaningful signal. The trainer is delivering horses race-fit, well-targeted, and ready to win. A horse from this stable, even at a moderate price, deserves more weight than its form figures alone suggest. The signal degrades sharply with smaller sample sizes. A trainer with two winners from three runners isn’t necessarily hot — they might just be lucky. The 14-day window with at least eight runners filters out the noise.
The second number is course strike rate. Some trainers consistently outperform at specific tracks because of their training methods, their proximity to the course, or simply because they target those venues. A trainer with a 28% course strike rate at, say, Wetherby across the last five seasons is bringing something to that track the average trainer doesn’t. The same trainer might run at 12% across all UK courses combined. The difference is real and bettable.
The third number — and this one is genuinely underused — is class-specific strike rate. Some trainers consistently win in Class 4 handicaps but rarely transfer that success to Class 2 or higher. Others operate exclusively at the top end and struggle when running horses in lower-grade events. Knowing where a trainer’s current form is concentrated tells you whether today’s race fits their pattern. The BHA’s 2025 Racing Report flagged a projected 6-7% decline in UK runner numbers between 2024 and 2027 — meaning trainer competition for available horses is intensifying, which makes the trainers running their best stock most aggressively the ones to watch.
Return on investment is harder to interpret. A trainer with 30% strike rate but minus 5% ROI is winning often at prices that already absorb that strike rate. A trainer with 15% strike rate and plus 8% ROI is winning less but at prices the market underestimates. For backers, ROI to level stakes is more valuable than strike rate alone over a full season.
Jockey Statistics That Predict Performance
Jockey form changes faster than trainer form. A jockey on a hot run can ride three winners in an afternoon at one track and four more across the next day at another. A jockey in a cold spell can spend a fortnight without seeing the winner’s enclosure despite riding for top yards. Tracking jockey form is essential to interpreting racecards correctly.
The 14-day jockey strike rate operates the same way as the trainer version. Above 20% over a sample of fifteen or more rides is a strong indicator of a jockey in form. The strike rate alone doesn’t tell you whether the jockey is winning on horses they should have won on or pulling off rides others couldn’t manage. The corollary metric — strike rate when riding outside their usual stable — is more revealing. A jockey winning at high rates as a freelance pickup rider is operating at a higher level than a jockey whose winners are concentrated on a single trainer’s best horses.
Course experience matters more than punters typically appreciate. Some jockeys ride certain tracks dramatically better than others. The reasons vary — familiarity with the gradient, comfort with the turns, history of getting the right tactical positioning. A jockey with a 22% strike rate at Chester is bringing something a jockey with a 9% strike rate at the same track isn’t. Both might have similar overall career numbers. The course-specific edge is the part that matters.
The conditional jockeys — apprentices in flat racing, claimers in National Hunt — bring weight allowances that genuinely affect a horse’s chance. A 7-pound claimer reduces the horse’s weight burden meaningfully on the flat. Whether that allowance compensates for the experience gap depends on the jockey’s strike rate at their current claim. A claimer running at 18% strike rate is worth using; one at 6% strike rate isn’t, regardless of the weight saving.
One pattern that rewards close attention: jockeys who book multiple rides at the same meeting tend to know what they’re doing. If a top-class jockey accepts five rides across a Sandown card, the connection between them and the relevant stables is intentional. Those rides are typically the ones the stables expect to deliver. Tracking the bookings list alongside the form is a free piece of information the market underuses.
Trainer-Jockey Combinations: Why Partnerships Matter
The most powerful predictive metric on the racecard isn’t either trainer form or jockey form in isolation. It’s the combination. A specific trainer-jockey partnership that has produced winners at a high rate over a meaningful sample is generally a stronger signal than either component alone.
The reason is straightforward. When a top yard books a specific jockey repeatedly, the relationship has typically been earned. The jockey rides the way the trainer wants the horse ridden. The jockey understands what each horse needs tactically. The trainer trusts the jockey to deliver on instructions. These soft factors don’t show up in form figures, but they show up in results.
The numbers to track: how often has this combination produced winners, over what sample, and at what strike rate. A trainer-jockey partnership running at 25% strike rate over fifty rides represents a genuine bond. The same partnership at 14% over fifty rides represents an inconsistent relationship — the jockey is being used because they’re available, not because they’re the right rider for the horse.
Retained riders — jockeys formally attached to specific stables — are usually the strongest example of high-quality partnerships. When a retained rider gets the call for a stable’s top horse in a big race, the trainer’s confidence in the rider is implicit. When a stable’s normal jockey is “missing” from a key ride and a different jockey is in, something has changed. Either the trainer has lost confidence in the regular jockey for this specific horse, or there’s a scheduling conflict, or — sometimes — the trainer is signalling lower confidence in the horse itself. Reading these signals requires watching the booking patterns over time.
The reverse pattern is also useful. When a top jockey accepts a ride for a stable they rarely partner with, the combination usually means one of two things. Either the trainer has booked the best available rider for a horse they really fancy, or the jockey has chosen the ride over other options because they rate the horse highly. Either interpretation favours the bet. The combination of an out-of-pattern jockey booking and a horse with credible form is one of the cleanest signals on any racecard.
For a fuller framework on how these signals combine with form figures, my full guide to horse racing form analysis walks through the systematic approach to reading the racecard that trainer-jockey data extends rather than replaces.
Where to Find and How to Apply These Statistics
The good news for UK punters is that trainer and jockey statistics are not gated behind expensive subscriptions. The Racing Post displays 14-day form for both trainers and jockeys on every racecard. Most online bookmakers and exchange platforms reproduce this data alongside their markets. Specialist sites like At The Races and Sporting Life publish course-specific strike rates for free. The information is there. The challenge is using it without becoming mechanical.
The mechanical trap is the most common mistake. A punter learns that 14-day strike rate is meaningful and starts backing every horse from a hot stable regardless of price or form. Within six weeks the strategy collapses because the punter is betting horses with no genuine winning chance simply because their trainer is running hot. The data is a filter, not a selection method.
The framework I use: do the form work first. Identify the horses that fit on form, going, class, and trip. Then apply the trainer-jockey filter. Does the trainer’s current 14-day form support this bet? Does the jockey’s recent strike rate support it? Is this a trainer-jockey combination with a history of producing winners? If all three answers are positive, the bet is reinforced. If one or more is negative, the bet either gets reduced stakes or gets dropped from the list.
The corollary discipline matters equally. Sometimes the form filter and the trainer-jockey filter disagree. The horse looks great on form, but the trainer is in a cold spell and the jockey hasn’t had a winner in two weeks. The right response usually isn’t to bet the horse anyway — it’s to flag the disagreement and bet smaller, or skip the race entirely. UK racing produces roughly thirty-four scheduled fixtures per week. There’s always another race. Forcing bets on conflicting signals is the route to mediocre P&L.
Race timing data adds another layer worth tracking. The BHA’s Q1 2025 report noted that 87.6% of races started within two minutes of their scheduled time, up from 79.2% in 2024 and 72.7% in 2023. That improvement reflects better course management, meaning horses run more reliably to the conditions reported in the going book and jockey decision-making becomes more transparent.
Building a Personal Watchlist
The punters I know who consistently profit from trainer and jockey data don’t try to track every yard in the country. They maintain a personal watchlist of perhaps fifteen to twenty stables they follow closely. Those stables get monitored weekly — runners, winners, strike rates, ground preferences, target races. Everything else gets the basic 14-day check on the racecard.
The watchlist should cover a range of styles. Two or three top-end yards whose runners always need consideration. Four or five mid-tier yards whose form swings produce regular value when they hit hot streaks. A handful of specialist trainers — small operations that produce winners disproportionately at specific tracks or in specific conditions. A couple of National Hunt-only yards if you bet jumps; the same for flat-only stables if you focus on that code.
The reason the watchlist works is concentration. You cannot meaningfully track 200 UK trainers. You can comfortably track 20. The depth of knowledge you accumulate on the trainers you follow closely makes their runners far easier to evaluate than runners from unfamiliar stables — and that depth of knowledge is the actual edge.
I update my watchlist quarterly. Trainers fall off when their form deteriorates structurally. New trainers get added when their numbers start showing patterns worth following. The list itself is the asset, not any individual entry on it.
The casual approach to trainer and jockey data is to glance at the form figures and place the bet. The disciplined approach is to make those statistics part of every bet decision, layered on top of form analysis rather than overriding it. Richard Wayman, Director of Racing at the BHA, has observed that the betting environment remains challenging and the horse population continues to decline — both factors that make the trainers running their best horses, with their best jockeys, easier to identify on the racecard, not harder. The signal is sharper than ever. Use it.
What minimum sample size makes a trainer’s strike rate meaningful?
At least eight runners over a 14-day window for short-term form signals. For course-specific or class-specific strike rates, twenty or more runners is the minimum for the figure to be reliable. Anything below those thresholds is too small to distinguish genuine pattern from random variation.
Should I weight recent 14-day form more heavily than season-long stats?
Yes, particularly for evaluating today’s race chances. 14-day form captures whether the stable is currently delivering race-fit horses, which is the most relevant question for the next race. Season-long stats tell you about general capability but not about current condition. Use both, with the 14-day figure carrying more weight for immediate bet decisions.
Published by the Horse Racing bet Strategy team.