
The Favourite-Longshot Bias in UK Horse Racing: What the Data Reveals
 Available in US
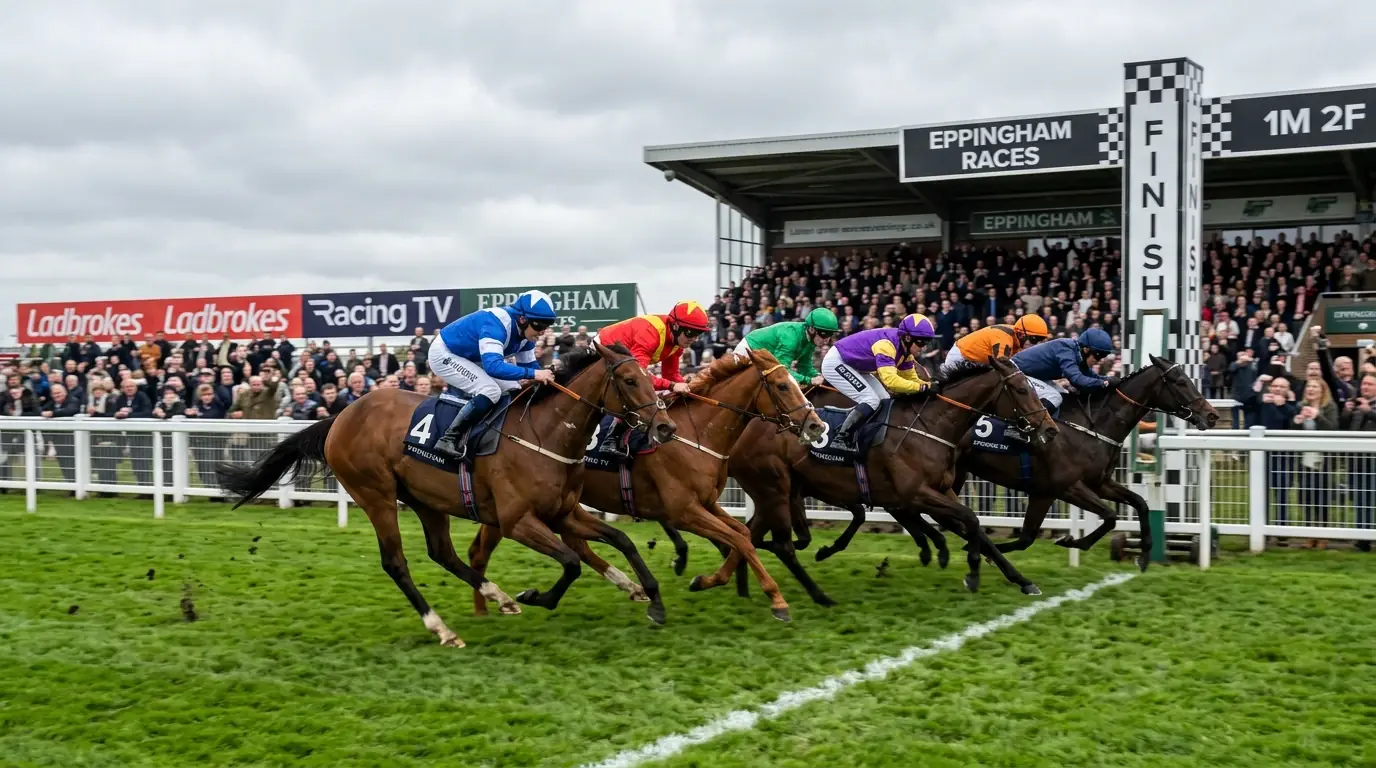
I remember the exact afternoon I stopped backing rags. It was an October Saturday at Newmarket, I’d put £20 each-way on a 33/1 shot in a maiden, watched it labour home in twelfth, and totted up my outsider bets for the year. Forty-seven longshot punts, three winners, ROI minus 41%. The numbers didn’t lie, but they hid something important that took me another year to understand: the academic research had been telling punters about this pattern for half a century, and I’d ignored it because the romance of a big-priced winner felt better than the maths.
The favourite-longshot bias is one of the most thoroughly documented anomalies in any betting market on earth. In essence: short-priced horses win more often than their odds suggest, and long-priced horses win less often than theirs. The market consistently overprices outsiders and slightly underprices favourites. Understanding why this happens, and how to exploit it, is the closest thing to a free lesson in market efficiency that UK racing offers.
This guide unpacks what the bias actually is, what decades of academic research has shown, and the practical ways serious UK punters use the bias to find an edge.
What the Favourite-Longshot Bias Is and Why It Exists
Start with the raw numbers. UK favourites win roughly 30 to 35% of all races. In handicaps the figure dips to around 25.7%, in novice races it rises to about 33%. Odds-on favourites on flat turf win approximately 59% of the time. Second favourites win about 20% of races, third favourites somewhere between 12 and 15%, and the top three combined account for 65 to 70% of all winners.
So far, so unsurprising. Now look at the corresponding ROI numbers. Backing every UK favourite at level stakes returns roughly 93% of stakes — a loss of about 7%. Second favourites return around 88%. Third favourites about 85%. Backing every horse priced at 33/1 or longer at level stakes? The historical ROI sits well below 60% over large samples. The losses on outsiders are dramatically worse than the losses on favourites.
This pattern — the closer you bet to the favourite, the smaller your expected loss — defines the bias. The maths is brutal but consistent. If markets were perfectly efficient, every price band would show the same long-term loss equal to the bookmaker’s overround. They don’t. Favourites are closer to fair value; longshots are systematically overpriced.
Why does this happen? Three explanations dominate the literature, and all of them probably contribute.
First, risk preference. Most casual punters prefer the prospect of a big win at long odds to a high-probability win at short odds. That preference drives money into the longshot end of the market, shortening prices to a point where they no longer represent fair value. Bookmakers don’t need to manipulate the prices — punter behaviour does it for them.
Second, psychological asymmetry. Backing a 50/1 winner is a story you tell your mates for years. Backing a 4/6 winner is a story nobody wants to hear. Punters chase memorable wins, and bookmakers reward that chase by tightening longshot prices below what the maths supports.
Third, information asymmetry. Favourites are typically backed by sharper money — punters who study form seriously and act on edges. That money tends to be smarter, which means favourite prices get corrected closer to fair value. Outsiders are backed by softer money, which doesn’t apply the same downward pressure on overpriced runners.
Academic Evidence from UK and International Studies
The favourite-longshot bias was first formally identified in horse racing markets in the 1940s, and the body of evidence has only grown since. Researchers from Cambridge, the LSE, and the University of Nottingham have published extensively on UK racing markets specifically, and the findings hold across decades and across both flat and National Hunt codes.
The pattern that emerges is consistent enough to be useful. Returns on favourites in UK racing typically fall in a narrow band — minus 5% to minus 10% at level stakes. Returns on horses priced 10/1 to 20/1 typically fall around minus 15% to minus 20%. Returns on horses priced 33/1 and above can be minus 30% or worse. These are not small differences. Over a thousand bets, the gap between favourite betting and longshot betting compounds into a chasm.
What’s particularly interesting is what happens on betting exchanges. Early academic studies of Betfair markets — including detailed time-series analyses of pre-race prices, where new bets match approximately every 50 seconds with an average of around ten participants per market — found that the bias is weaker on exchanges than at bookmakers, but it doesn’t disappear. Even when punters can both back and lay, even when the structural overround drops to 2 to 5%, the longshot end of the market still trades at prices that imply higher win rates than actually occur.
One caveat the research is clear about: the bias varies by race type. It’s strongest in handicaps, especially big-field handicaps where casual money flows heavily towards romantic outsiders. It’s weakest in two-year-old maiden races, where private information from stables can dramatically reprice longshots that the public doesn’t know are working well. And it’s most pronounced at the very longest prices — 50/1 and above — where the gap between implied probability and actual win rate yawns widest.
The body of evidence is large enough that no serious academic disputes the bias exists. The arguments now focus on why it persists despite being well-known, how it interacts with newer market structures like exchanges and bet-builders, and whether it’s weakening over time as data-driven betting platforms grow.
Practical Ways to Exploit the Bias in UK Markets
Knowing the bias exists is interesting. Acting on it is what makes you money. There are three established approaches that take the bias from academic curiosity to a working part of a betting strategy.
The first approach: avoid the longshot end of the market. This sounds passive, but it’s genuinely valuable. If a strategy you’re considering involves backing horses at 25/1 or longer, the maths is fighting you before you even start. The expected return is meaningfully worse than the same strategy applied to the shorter end of the book. I’m not saying never back an outsider — I’m saying don’t make outsiders the backbone of any strategy. Backing every 33/1+ horse at level stakes returns approximately 93% if it’s a favourite, but barely 60% if it’s a longshot. That gap is the bias in action.
The second approach: layer favourites or short-priced contenders on the exchange. This is the inverse of the bias-exploitation method. If longshots are systematically overpriced, then in pari-mutuel logic, favourites must be slightly underpriced — meaning laying favourites should be a losing strategy on average. And it is. The win-rate data confirms backing favourites is closer to break-even than laying them. So if you find yourself drawn to laying short-priced favourites as a default strategy, the bias is working against you, not for you.
The third approach — and the most useful for serious punters — is to use the bias as a value filter rather than a betting system in itself. When you’ve done your form work and identified a horse you genuinely think is undervalued, the bias tells you something important about where to be more sceptical. A horse you’ve priced at 6/1 trading at 5/1 in the market is probably closer to fair value than your initial assessment suggests, because favourites and short-priced runners are priced more efficiently. A horse you’ve priced at 12/1 trading at 25/1 looks like a huge overlay, but the bias warns you that longshots are systematically overpriced — so the apparent value may be illusion rather than edge.
I use a personal rule: any horse priced longer than 20/1 needs to show me a stronger case for being undervalued than a horse priced 6/1 or shorter. The bias creates a higher bar at the longshot end, and ignoring that bar is the most common way punters bleed money over a season. For practical applications of value calculation against this background, my deeper article on value betting in horse racing walks through the expected value formula in full.
Why the Bias Persists Despite Being Famous
Markets are supposed to absorb known inefficiencies. Information becomes public, money flows in, the inefficiency disappears. The favourite-longshot bias has been documented since at least the 1940s, has been the subject of dozens of peer-reviewed papers, and is referenced in just about every serious book on race betting. Why is it still here?
The honest answer is that betting markets aren’t dominated by sharp money. They’re dominated by recreational money, and recreational punters keep doing what makes betting fun — backing longshots, chasing the thrill, ignoring the maths. So long as the bulk of money entering UK racing markets is driven by entertainment rather than edge-seeking, the bias will persist. The top 1% of UK bettors generate around 52% of total betting revenue, but that 52% includes substantial volume from punters who aren’t trying to beat the market — just to enjoy the sport with money on it.
That’s actually good news for anyone willing to bet differently. The bias survives because it’s rooted in human psychology, not in pricing errors that get arbitraged away. It will be there next year, and the year after, in roughly the same shape. Your job isn’t to discover it — academics did that 80 years ago. Your job is to discipline yourself into not feeding it.
Pick your battles in the short to mid-priced range. Demand more evidence before you back anything past 20/1. Treat exchange prices as your baseline of fairness, because they’re closer to it than bookmaker prices on outsiders. And track your own ROI by price band — I keep a simple spreadsheet that breaks down every bet I’ve made into price ranges, and the gap between my favourite betting and my longshot betting is exactly the gap the academic literature would predict.
Is the favourite-longshot bias present on betting exchanges?
It’s present but considerably weaker. Exchange markets show much tighter pricing than bookmaker markets, with overrounds typically 102 to 105% versus 110 to 125% at bookmakers. Academic studies of Betfair time-series data confirm the bias exists on exchanges but with smaller magnitude, especially at the longest prices.
Has the bias weakened in recent years with sharper markets?
The evidence is mixed. Exchange penetration and data-driven betting platforms have tightened pricing at the short end of the market, but the longshot end remains stubbornly overpriced relative to actual win rates. Casual money still flows disproportionately towards romantic outsiders, and that flow shows little sign of changing.
Created by the ”Horse Racing bet Strategy” editorial team.